Tag Archives: Options

BlackBerry($BBRY) Z10 UK Performance

black011

BBRY is having another good day today, a high of $16.89, but has now pulled back to $16.24. That being said, I would like to talk about some new data that came out.

Deutsche Bank conducted a survey in the UK to try and get an idea of how the new BlackBerry Z10 is performing. Analysts called 30 cell phone carriers in the UK and asked the same questions a new user who is in the market for a smartphone would ask. The negative that came out of the survey is that the BlackBerry Z10 isn’t being promoted much by carriers. The survey also found that sales representatives weren’t educated in using the new phone so they are hesitant in promoting something they aren’t sure how to use. This is not a good sign for BlackBerry. Below are some notes from the survey:

Results:

  • The iPhone 5 and Samsung Galaxy III are still the most recommended smartphones.
  • Out of the 30 phone carriers surveyed, only 2 recommended the BlackBerry as a smartphone.
  • A few sales representatives said they weren’t trained on the new BB10 operating software.
  • One sold have sold out of the Z10; some have sold many; and others have sold a few.
  • Reviews where mixed when they were asked to do a comparison between the iPhone 5, Samsung Galaxy III and the BlackBerry Z10.

After looking at these results, I’m more skeptical about the success of BBRY. The new phones are not released in the the US yet, so BlackBerry can still fix these issues that they’re facing abroad and not make the same mistakes when it gets to the US. I think the main reason carriers aren’t promoting the new BlackBerry Z10 is because they are not educated on all the new features of the phone. In my opinion, this is a mistake on BlackBerry’s part. Having unveiled this new phone so late in the game, BlackBerry should’ve held training sessions for sales reps. This way, sales reps would be familiar with the phone and would truly know why this phone might be better than any other smartphone currently on the market. Being familiar with the phone, they will be more likely to recommend the phone to users because they are able to explain all of the positives. Users with be more likely to sign a two year contract if they receive good reviews from the sales reps than if they don’t. Based on the survey, sales reps are currently recommending the iPhone 5 and the Samsung Galaxy III more often than the Z10.

That being said, I would look to take advantage of the volatility in the stock by using options to profit. However, I still am not 100% convinced that BlackBerry will be successful. I will still continue to see how BlackBerry deals with these problems and keep you updated on any new developments.

Tagged , , , , , , , , , , , , , , , , , , , , , , , ,

Is Blackberry($BBRY) back?

Today, the company formerly known as Research in Motion (RIMM) became BlackBerry (BBRY). On Friday, RIMM had closed at $13.03. Today, BBRY opened at $13.71, up 5.22%. Throughout the day, BBRY continued to perform extremely well despite a declining market. At the end of the day BlackBerry closed at $14.98, up 15.02% for the day. In after hours trading BlackBerry is trading up $0.15 or 1%. Overall, BBRY had a great day while the market heads lower— Dow down 0.93%, S&P 500 down -1.15% and the Nasdaq 1.51% lower.  So why did BlackBerry end up 15% higher today? Was the Super Bowl commercial that good, or does this company really have value? Let me lay out what I think every investor should know about BlackBerry before they take out their checkbooks and invest in this stock.

After numerous delays and development issues, BlackBerry finally unveiled their new phones on January 30th, 2013. On that same day, they also decided to drop the Research in Motion name and just simply be BlackBerry. The two phones are the BlackBerry Z10 and the BlackBerry Q10. The Z10 is 4.2 inch touchscreen smartphone, similar to the popular smartphones currently in the market, such as the iPhone. The Q10 however  still contains the iconic physical BlackBerry keyboard. Both will run the company’s new operating system, BlackBerry 10. Looking at the graph below, you can see that on the day of the announcement BlackBerry actually decreased. The reason, I think, is that investors have been waiting for BlackBerry to come out with a new phone for almost 18 months now, and this just wasn’t big enough to restore faith in BlackBerry. In addition, the fact that the phones wouldn’t be available in the US until March might have discouraged investors as well. This sent BlackBerry stock back into the $13 range, which is great entry point for the stock based on a Discounted Cash Flow (DCF) valuation (valuing the stock at $20) and relative valuation. However, I am a little skeptical to whether or not BlackBerry will be successful in the future.

rimm

Today, when BlackBerry started trading under the new name and ticker, BBRY, we saw it end the day up 15%. When i was trading BBRY today, it seemed as if I was trading an IPO. BlackBerry had been on a downtrend ever since the unveiling of the two news phones, and today, as soon as it started trading under the new ticker we see it do extremely well. I read an article today that said that sales in the UK seem to be strong. Some places where running out of the phone, and most where seeing strong demand. According to a note obtained by Forbes, an analyst at Jefferies stated that “We estimate sell-in to be at least several hundred thousand units. To put that in perspective, the iPhone had first weekend sales of 5 million+ in the U.S. The U.S. is five times larger so continued strong sales could bode very well for Blackberry.” If this holds true, BlackBerry will see their stock jump higher than the 15% we saw today.

I would be very skeptical when trying to trade BlackBerry. Early indicators such as UK sales, tell us that they might have a good product and people might like it. However, we have to keep in mind that it might be a little too late for them. People have already fallen in love with the iPhone and the Galaxy, so it might be tough trying to win these users over. Also, the US will be the biggest test to see if BlackBerry will comeback and be successful. Since the new phones will not be available in the US until end of March/early April, it will be tough to see if they can regain some market share. I will continue following BlackBerry and see how the new phones perform in the UK and Canada. This will give me and idea of how the phones might perform in the US once they are released here.  That being said, I think that BBRY does have potential but I’m not 100% convinced yet. I would continue trading this stock at small blocks or even options. This way, you will not be risking much and at the same time you will not miss any big moves, like the one today. I will keep you guys updated as more data comes out.


Tagged , , , , , , , , , , , , , , , , , , , , , ,

Using Options to Profit on Low Volatility Stocks

When investing in the market, it’s not always necessary for the price of a security to move in order to make a profit. There are multiple ways to profit from low volatility stocks. Below I will discuss my two favorite option strategies which will allow you to profit when the price of the underlying security doesn’t move.

Iron Condor

This is by far one of my favorite strategies to use when I’m dealing with securities which have historically low movements in price. This strategy is called an Iron Condor, and is a non-directional strategy, meaning that a profit will be incurred if the price of the underlying security doesn’t experience high volatility. The profit, however, is typically low with an iron condor due to the fact that your risk is limited—unlike a naked call/put, where the loss can be infinite.

To put on an iron condor, a trader must open the following positions expiring in the same month:

1

This will result in a net credit for the trade, which is collected upfront. If you look at the P&L Chart above, to maximize your profit, the price of the underlying security must stay between the Short Put strike and Short Sell strike.  While maximum loss occurs if the underlying stock price is higher than the Long call strike or lower than the Long Put strike.

Iron Butterfly

An Iron Butterfly is similar to an Iron Condor, however it usually offers a higher maximum profit due to the lower chance of gaining the maximum profit. Like an Iron Condor, this strategy also offers limited risk.  With this strategy, the probability of earning some sort of profit is relatively high, compared to other strategies.

To put on an Iron Butterfly, you must open the following positions expiring in the same month:

2

This trade will result in a net credit, which will be collected upfront. As you can see from the P&L Chart above, profit will be maximized when the underlying stock price at expiration is equal to the strike price of the Short Call/Put.  Maximum loss, on the other hand, is realized if the underlying stock price is over the strike price of the Long Call or if it’s under the strike price of the long put.

These two strategies are my favorite to use when trying to profit from low volatile stocks. Like I mentioned above, the profit will be tremendously less than using naked calls/puts, however the risk is tremendously less as well, making these strategies a good way to make a nice consistent profit.

Check back early next week, as I will show you one of my trades using one of these strategies and keep you updated on how it does.


Tagged , , , , , , , , , , , ,

Long Caffeine: Dunkin’ Brands Options Trade Review

I had a conversation with some heavy hitting financial professionals (who will remain nameless for confidentiality purposes) a couple of weeks back regarding the recent price depreciation in Coffee with relation to the companies that are affected by the commodity due to their exposure in the industry they reside.  The initial portion of the conversation was made up of discussing the technical aspect behind the Coffee move, eventually leading to a discussion between who had more upside during 2013:  Starbucks (Ticker: SBUX) or Dunkin’ Brands (Ticker: DNKN).  Over drinks, the companies internal structures began to get broken down:  SBUX locks in their commodity prices a year out to avoid any extreme volatility, and DNKN…  Well…  How exactly does that company control their Coffee commodity risk?  The conversation ended, the drinks continued, and the evening was a phenomenal one; it got me thinking, however, about the dilemma we ran into during our discussion about DNKN and how they indeed monitor risk.  Based on this evening and following a simple risk assessment and the known fact that earnings were right around the corner (the initial Whisper Date being February 8, 2013, prior to the official company announcement of January 31, 2013 @ 8:00am ET), I got long eight contracts of DNKN February 2013 37.50 Calls at $0.30 and began delving into the company’s fundamental picture.

Let’s break down the Coffee industry as a whole before we get into DNKN’s specifics.  As a common misconception, many people think that Coffee is a bean when in fact it is a berry that a bean comes from; instead of coming from the ground, it’s actually a hanging piece of fruit that is more like a seed than a bean.  The most heavily picked, produced, and roasted species of this particular fruit is the Arabica coffee bean, which is what many of the leading coffee supplying fast-food joints (including McDonald’s, leaving SBUX and DNKN alone) and suppliers of K-Cup producers (the leader being Green Mountain Coffee Roasters) use.  The Arabica bean is what the Coffee contract on the ICE and CME track (Contract: KC_#), with the second most-produced bean, the Robusta bean, being tracked on the NYSE Liffe.  Both of these particular beans are most popularly produced in Latin America, and similar to fine wines, need a particular soil and climate in order to get the best quality.  Because Arabica makes up 70% of the world’s coffee production, the first thing I wanted to see is how the KC contract compared to DNKN’s percentage performance since the company’s IPO in late July 2011:

DNKN, KC 5yr Percentage Comparison  (1232013)

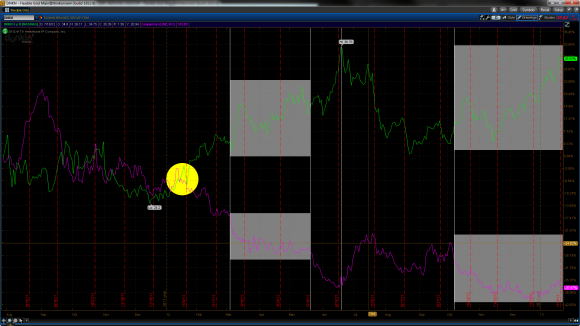
This is where we can see the clear inversion at the turn of 2012 that took place (denoted by the yellow circle) and two particular inverted price areas that struck me as interesting.  From March to May, the price appreciation of DNKN stock was approximately 10%, where as after an initial drop off in the price in Coffee, we see a tight price fluctuation and a breakdown that occurred throughout most of June.  Over a time period that is two times longer, from October 2012 to present, we see close to a 20% move in the DNKN price and a tight price fluctuation that has yet to truly blow out in Coffee.  The question is whether or not Coffee has anymore room to move lower, and if it does, how low will it go and will a further price decline result in DNKN’s stock price moving higher?  We can get a completely different picture of this correlation through a paired chart over the same time period:

DNKN, KC 5yr Price Comparison  (1232013)

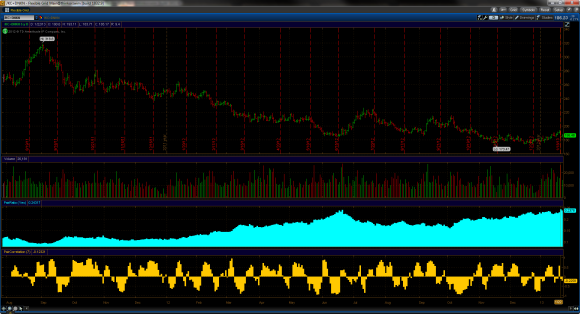
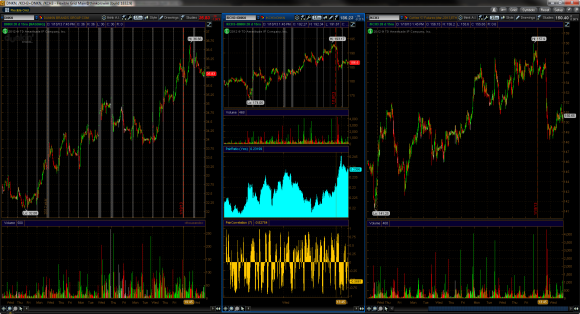
Looking at the Pair Ratio indicator (teal), we can see that over the price depreciation in Coffee, the ratio became tighter and tighter.  On the slight Coffee rally, the ratio backed off and the price of DNKN stock, as you saw from the previous chart, pulled back with the ratio.  We’re currently at a Pair Ratio level that has been accurate on calling DNKN stock tops in the past, but with earnings approaching next week and a similar pattern we’ve seen in before, the probability of a DNKN stock spike before the stock pulls back is more likely on a bullish earnings report.  The most recent price activity from yesterday’s close on a 15 minute, 20 day time frame can be seen below:

DNKN, KCH3 Side-By-Side  (1232013)

Through my trusted resources regarding the most recent prices of a DNKN coffee (also known as close friends who can’t go a day without having three cups), a 12-ounce “Cup of Joe” will run you about $1.95.  DNKN has research from the National Coffee Drinking Trends Study (2004) that shows statistics of approximately 2.7M cups of coffee being sold a day by the company.  What does simple math tell us about this?  That DNKN makes sales revenue every day, ceteris paribus of all costs, of about $5.27M.  If you REALLY want to extrapolate the data and figure that DNKN franchises are open 350 days a year, we see a yearly sales revenue of $1.8B.  DNKN had revenues in fiscal year 2011 of approximately $628M, and so far through three quarters of fiscal year 2012, the company has put up $496M in revenues; through another extrapolation, the company should be on par for matching revenues from last year with the possibility of a slight beat being great.  So, where does the company really take the cake on becoming a growth play for this upcoming quarter?

Two words:  franchise expansion.  DNKN CEO Nigel Travis announced not only a new push to expand on the West Coast of the United States, the most recent expansion announcement from the company, but also overseas to expand in the Chinese and Indian market.  Both expansions are set for 2013, but the company’s expansion growth so far is close to 4.00% in the United States for this past year.  With their push to move the brand internationally, the company is making huge strides and is cutting their cost through franchising the operations…  And how do the franchises and the company as a whole control their commodity costs, their biggest burden as connected as they are to the Coffee commodity?  They outsource the production of coffee beans to the National DCP:  the franchise pays the supply chain manager for services, DNKN pays the supply chain manager a set fee, and the game of fiddling with commodity prices is handled by the middleman entity.

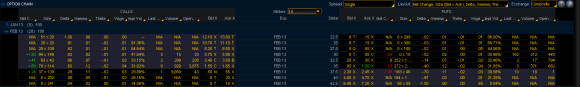
In the anticipation of this earnings report, someone has become incredibly bullish on the stock within the February options chain.  On the day before the contract rollover last week, we saw typical, very illiquid activity in the February 2013 37.50 Calls and I thought nothing of the premium fluctuation back to my entry price as DNKN underlying stock had rallied on the decrease in price of Coffee.  I added another four contracts, as the tape in DNKN was fairly bullish and had busted a couple of technical levels I was paying attention to.  The following day on the official options expiration day, an influx of orders rolled through the 37.50 Calls and by the close on Friday, 9850 contracts had been traded on an open interest of 43:

DNKN Option Chain  (1172013)  DNKN Option Chain  (1182013)

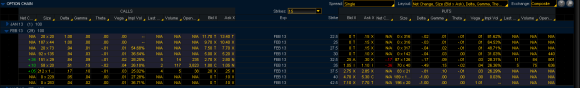
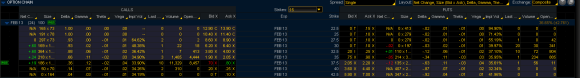
Gangbusters – I closed out a third of my position and was willing to see what we got going into the week ahead.  When this activity continued through Tuesday and Wednesday, however, I realized that there was someone out there that has the same thoughts about earnings that I do, as this particular strike price became the most heavily traded of the entire chain (including other months that could have been traded):

DNKN Option Chain  (1222013)  DNKN Option Chain  (1232013)

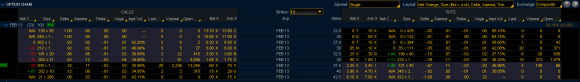
After closing out another third of my position on Tuesday, I continue to hold my final third and will continue to do so through the earnings report next week.  Due to the elevated premium of the 37.50 Calls, I would be incredibly cautious about buying into this strike right now; a way to take advantage of this, however, would be to create a Vertical Spread on the February 2013 37.50 and 40.00 Calls if you share the same bias I do regarding the company’s earnings.  Bring on the 31st!

– ZMoose

“Did You Know?” Dunkin’ Brands Fast Facts ; “Arabica Premium” Bloomberg Article ; Dunkin’ Donuts Announces Plans to Enter SoCal

** All other information regarding the company was found from the most recent 10K and 10Q reports **

Tagged , , , , , ,

As History Would Have It: An $AAPL Earnings Play

OB-TW733_apple0_E_20120724165406

What:

To profit from Apple’s earnings report this Wednesday, we are going to create a strangle using out-of-the-money options.

Why:

Date Estimate Actual Close Pre Earnings Close Post Earnings Percent Change
10/25/12 $8.75 $8.67 $609.54 $604.00 -0.91%
7/24/12 $10.36 $9.32 $600.92 $574.97 -4.32%
4/24/12 $10.06 $12.30 $560.28 $610.00 8.87%
1/24/12 $10.08 $13.87 $420.41 $446.66 6.24%
10/18/11 $7.28 $7.05 $422.24 $398.62 -5.59%

Simply put, I am making this trade based on history. Nothing more, nothing less.

Historically, Apple stock exhibits volatile and large price movements following it’s earnings releases. In fact, four out of the last five earnings reports have resulted in price movements of at least four percent. With that being said, it is not unreasonable to anticipate a significant price movement following Apple’s earnings report this Wednesday. In order to take advantage of this, we can employ a basic strangle using out-of-the-money options that will allow us to profit from a significant price movement, regardless of direction. A strangle also limits the loss of the position to the net cost.

How:

Price Call Strike Price Put
25.9 $485.00 $11.00
23 $490.00 $13.05
20.3 $495.00 $15.30
17.8 $500.00 $17.75
15.45 $505.00 $20.40
13.35 $510.00 $23.20
11.45 $515.00 $26.15
9.65 $520.00 $29.40

To successfully create a strangle, we need to take long positions in an out-of-the-money call and an out-of-the-money put. It is recommended that the strike prices of these out-of-the-money options be equidistant from the current price of the underlying instrument, which in this case is Apple common stock. The further out of the money the options are the cheaper it will be to establish the strangle and the smaller our max loss per contract will be. However, the further out of the money the options are, they less likely the strangle will expire in the money.

Currently, the price of the underlying Apple common stock is exactly $500.00 (Cool, I know). Using the January weeklys, which will expire this coming Friday (January 25th, 2012), I am going to take a long position in a call with a strike price of $510.00 and a put with a strike price of $490.00. These options are priced at a per contract cost of $13.35 and $13.05, respectively. Since we are taking a long position in both the out-of-the-money call and the out-of-the-money put, our net per contract cost is equal $26.40. Options contracts are usually denominated in terms of 100 shares meaning the absolute net per contract cost of this strangle is $2640.

Profit/Loss & Break-even:

Break Even

When using a strangle, there are two break even points. Ignoring the cost of commissions, there is a break even point below the strike price of the out-of-the-money put (B1) and above the out-of-the-money call(B2). B2 can be calculated by subtracting the per contract cost from the strike price of the out-of-the-money put. B1 can be calculated by adding the per contract cost to the strike price of the out-of-the-money call. In this particular example we can calculate B1 by subtracting $26.40 from $490, giving us a break even point of $463.60. Similarly, we can calculate B2 by adding $26.40 to $510, giving us a break even point of $536.40.

Profit Loss

Scenario 1: Max Loss

As I mentioned before, my max loss per contract is limited to the absolute cost of the contract. In this particular setup, my max loss is $2640.00. I will experience this max loss if the price of the underlying at expiration is between the strike price of the put and the call. Specifically, I will experience this max loss if the price of the underlying at expiration is between $490.00 and $510.00. In my opinion, this is not likely but could happen if Apple reports earnings consistent with estimates, no misses or beats.

Scenario 2: Loss

If the underlying price change of Apple is not big enough following Apple’s earnings report, I will experience a loss less then my max loss at expiration. This can happen if the price of the underlying is in one of two ranges. The first range is if the underlying price closes below the strike price of the out-of-the-money put, but above b1. Similarly, the second range is if the underlying stock price closes above the strike price of the out-of-the-money call, but below b2. The loss in these situations is equal to difference between the price of the underlying at the sale and the strike price, plus the cost of the contract.

For example, lets say the price of the underlying Apple stock is $520.00 at expiration. Since I am long the $510.00 January weekly, I will be able to buy 100 shares of Apple at $510.00 and sell them on the open market at $520. This means I will make a profit of $10.00 per share. Even though I profit on the sale of the Apple shares on the open market, I am still responsible for the cost of the contract, which is $26.40 per share. This leaves my net loss at $16.40 per share, or $1640.00. As you will notice, this is still a loss but is less then my max loss.

Scenario 3: Profit

This is the most desirable and most likely scenario in my opinion. There are two situations in which I will experience a profit. The first is if the underlying Apple Stock price at expiration is below B1, and the second is if the underlying Apple stock price at expiration is above B2. In the first situation, I will be able to sell the underlying shares higher then market price. In the second situation, I will be able to sell the shares at a higher then market price. If the underlying stock price when I exercise is less then B1, the Profit will be equal to the difference between B1 and the price of the underlying at expiration, minus the per contract cost of the strangle. If the price underlying Apple stock price when I exercise is above B2, the profit will be equal to the different in the underlying price at expiration minus B2, minus the per contract cost.

For example, lets pretend that the price of the underlying Apple stock at expiration is $545.00.Since we are long the $510.00 January weekly, we will be able to buy the underlying at $510.00 and sell at the market price of $545.00. Since we paid $26.40 for the strangle, our per share profit will be $8.60 ($860.00).

Tagged , , , , , ,